
 |
Florida Birth Query System HelpMeasureRow Variable Column Variable Counties Year Row Percentage Report Column Percentage Report Frequency Report Frequency and Rate Report Report Toolbar MeasureA measure is a type of count. The broadest measure is total resident births. All other measures aresubsets of total births. When you choose a measure, you can view either counts (frequencies) or counts and rates (i.e. "Percent Low Birth Weight Births"). There is no rate available when you choose total births as your measure. Back to Top Row VariableThis is the variable that appears on the left hand side of your table. Rows always read LEFT to RIGHT.The row and column variables must be different. 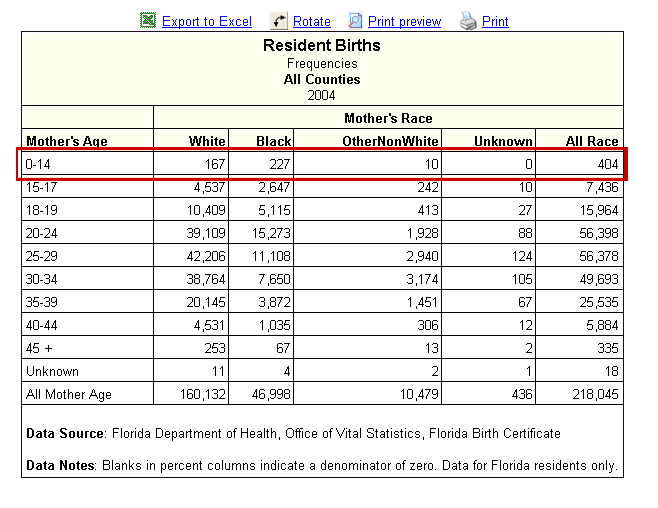
Back to Top Column VariableThis is the variable that appears on the top of your table. Columns always read TOP to BOTTOM.The row and column variables must be different. 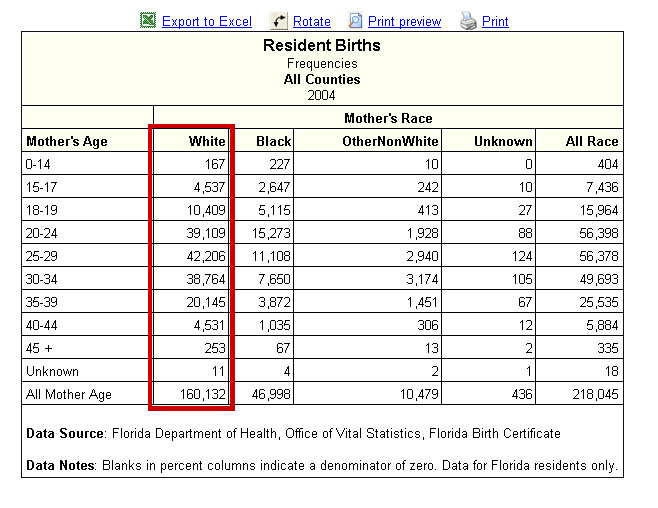
Back to Top Counties/Healthy Start CoalitionsCountySelect the desired county or counties and then click "Add" to add the county to the report. If "County" is not selected as the row variable, the report will display the sum of the counties selected. If "County" is selected as the row variable, the report will also display the state total. If you select "County" as your row variable and "All Counties" as your county selection, the report will list all 67 counties and the state total. Healthy Start Coalitions To display data by Healthy Start Coalition, select the radio button next to "Healthy Start Coalition". When this option is selected the dropdown list will change from counties to coalitions. Only one coaltion may be chosen at a time (both the "Add" and "Remove" buttons are disabled"). If "County" is chosen as the row variable, the report will display the individual counties that comprise the selected Healthy Start Coalition. For more information about Healthy Start Coalitions in Florida, visit their website at www.healthystartflorida.com. 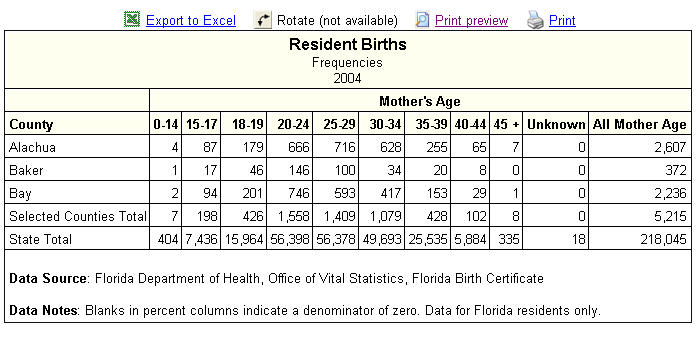
Back to Top YearHold down the CTRL key and click to select multiple years. If "Year" is not selected as a row orcolumn variable, the data in the report will be the sum of the selected years. If "Year" has been selected as either a row or column variable, the selected years will appear in separate rows or columns. 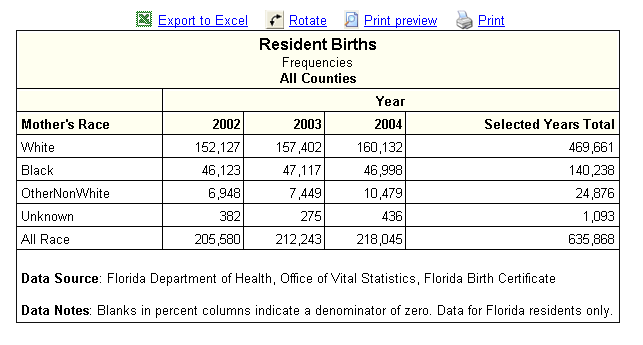
Back to Top Create a Trend Graph
You can create a trend graph by following these instructions: Row Percentage ReportIn the row percentage report, each category is shown as a percentage of the row's total in the last columnof the table. The category percentages may not add up to 100 due to rounding. 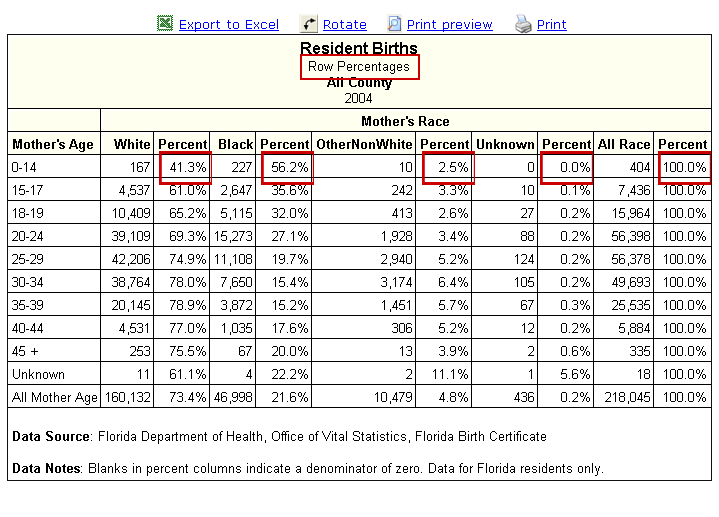
Back to Top Column Percentage ReportIn the column percentage report, each category is shown as a percentage of the column's total in the bottomcell of the table. The category percentages may not add up to 100 due to rounding. 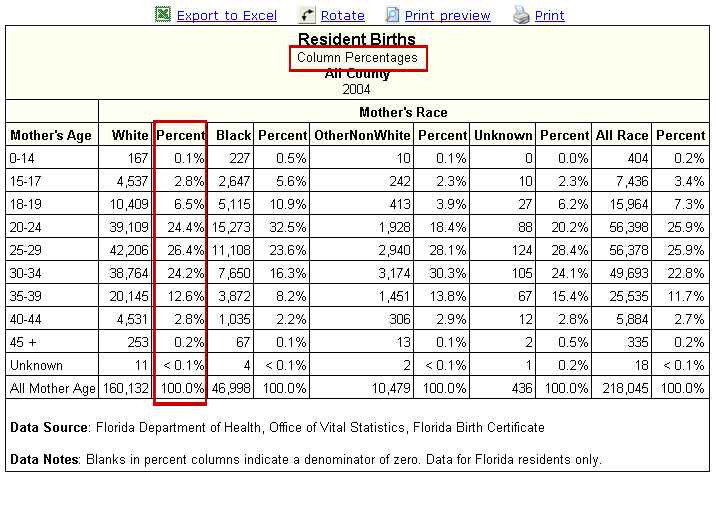
Back to Top Frequency ReportIn the frequency report, only counts of births are shown. There are no row or column percentages or rates.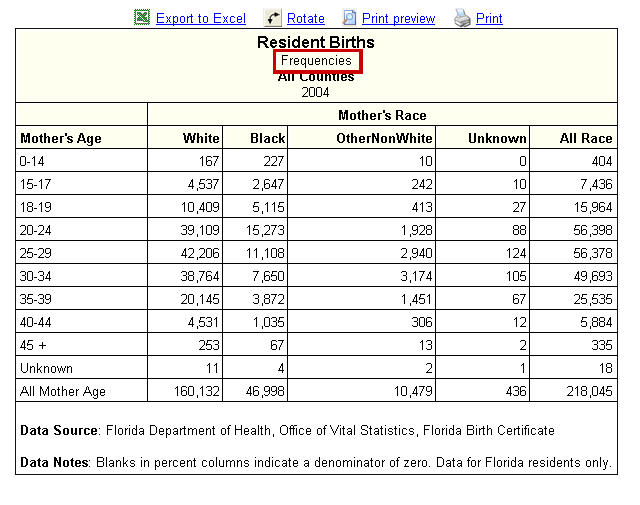
Back to Top Frequency and Rate ReportIn the frequency and rate report, both counts of births and percentages are shown. These differ fromthe row and column percentage reports because the denominator is frequently total births and not a row or column total. The denominator is shown in the footer of the report. To view one of these reports, you must choose a measure other than total births (i.e. "Low Birth Weight"). 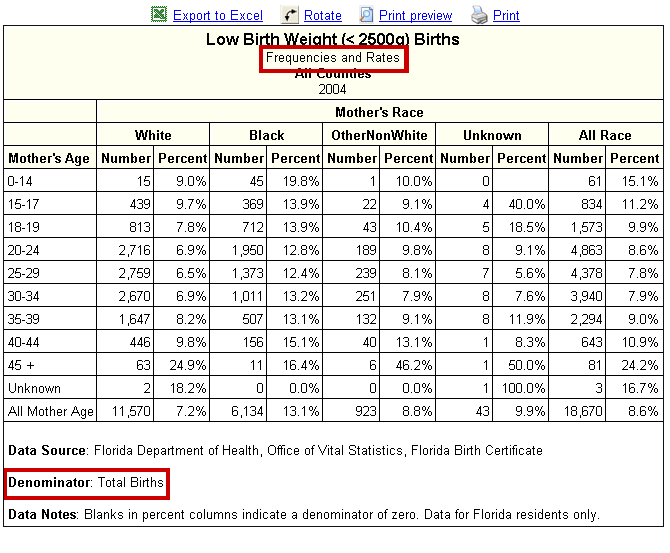
Back to Top Report Toolbar
Click this link to export the report to MS Excel. You must have Excel installed on your computer in order for this to work. Once the spreadsheet is opened, click File>Save As to save the document. 
Click this link to rotate the report. This will simply switch the rows and columns in the report. Click the link again to switch to the original position. 
Click this link to see how the report will look on a printed page. If a report is too wide, consider selecting Landscape page orientation. This is accomplished using the Page Setup dialog box. 
Click this link to print the report. You must have a printer installed in order for this to work. Back to Top |